How do I import data into Google Analytics?

You can use account linking or data import to import data from other sources into Google Analytics without using the tracking code. The data you import from these two options will be processed along with all the hits you collect from the tracking code.
Starting with account linking, you can link Google Products such as Google Adwords, Google Adsense and Google Webmaster Tools with Google Analytics. When you link a Google Product, the data from the product will flow to your Google Analytics account. For example, if you link your Adwords account to your Analytics account, you’ll be able to see your Adwords clicks, impressions and cost data in your Analytics reports.

Additionally, you can import data into your Google Analytics account. To import data into your Google Analytics, a key must exist in both your imported data and Google analytics. The key is the common element that connects the two sets of data.
There are two ways to import data:
1. Dimension Widening
2. Cost Data Import

With dimension widening, you can import almost any data into your Google Analytics. For example, let’s say that you own a library and have a database full of authors and topics. You can import this data into Analytics so that you can segment your data by Author and Topic as long as there is a key for each one. A key that may work for this would be page URLs or some other data that you can find on Google Analytics that you can apply to the imported data. To import this data, you can import a file such as an excel spreadsheet.

With cost data import, you can use this to calculate costs from your non Google advertising campaigns such as Facebook Ads, Twitter Ads, Yahoo ads and more. You’ll need to have campaign source (Yahoo, Bing, Facebook, Twitter) and campaign medium (ppc, display, etc). Data import can be time consuming if it is frequently updated so it’s also recommended to develop a program that uploads the data automatically to Google Analytics using API.

For more information on the reporting APIs, go to: https://developers.google.com/analytics/devguides/reporting/
Filed under: Digital AnalyticsDocumentation
Tags: , , ,


How do I transform data in Google Analytics with filters?

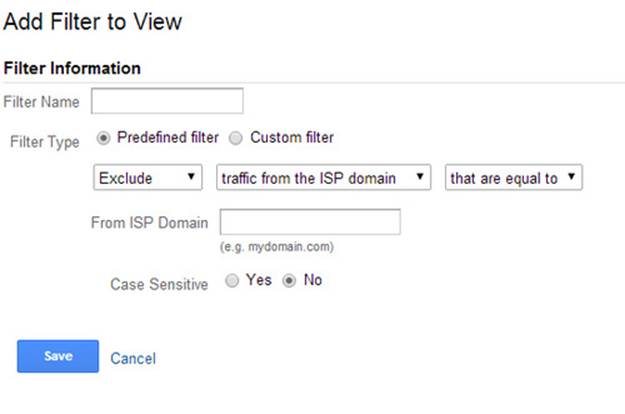
Filters allow you to include, exclude or change the way the data is shown in your reports. For example, you can create a filter to exclude IPs or to clean up URLs into readable text. If you have a filter that excludes an IP, any hit coming from that IP will be permanently removed from your report data.
In “Admin” page, select the view you want to add a filter to and click “Filter”. On the add filter page, you will be able to set the filter information like so:
image307

Filed under: Digital AnalyticsDocumentation
Tags: , , , ,


How do I transform data in Google Analytics with goals?

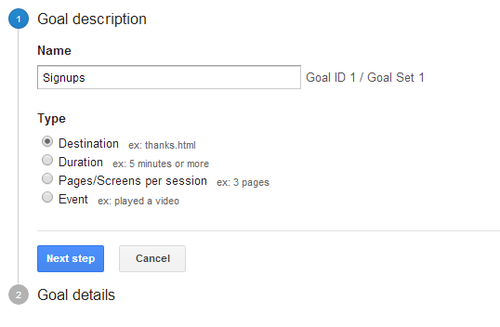
Additionally, you can set up goals to transform your data. Setting up goals can create new metrics like conversions and conversion rate. For example, you can set up a goal to track sign ups. Each time someone signs up, it will be recorded in Google Analytics as a conversion. In “Admin” page, select the view you want to add a goal to and click “Goals”. Click “New Goal”. Input your goal name and goal type then click next step.
image299

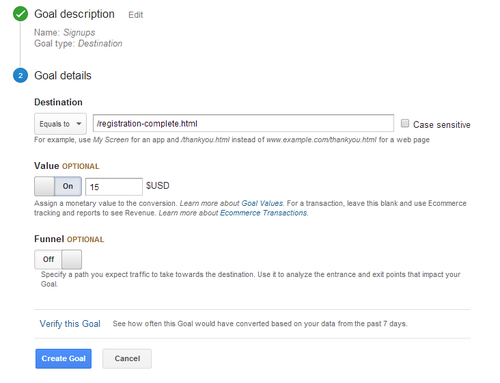
Let’s say that every time a person signs up they are sent to the page: /registration-complete.html. You can set that as your destination page URL. You can also assign a value. For example, if you sell a service that costs $15 you can set the value of each sign up to $15 giving your conversions a monetary value. Even if they do not pay right away and are just a prospect, you can set a monetary value to your goal. For instance, if on average 1 person out of 5 signups actually buy your service at $15 after signing up, you can set the value for each sign up to be equivalent to $3 per sign up since it takes 5 signups for one $15 conversion (5 * $3 per sign up = $15 conversion).
image301

Filed under: Digital AnalyticsDocumentation
Tags: , , , , ,


How do I aggregate data in Google Analytics with grouping?

Grouping allows you to aggregate data together so you can analyze the collective performance. There are two kinds of grouping:

1. Channel Grouping
2. Content Grouping

Channel grouping is a collection of common marketing activities such as display, social, email and paid search. By default, Google Analytics will set a Default Channel Grouping with Direct, Organic Search, Social, Email, Referral, Paid Search, Other Advertising and Display. To add a new channel grouping, go to “Admin” page, select the view you want to add channel grouping for and click “Channel Settings”. Click “Channel Grouping” and click the “New Channel Grouping” button. Let’s create a channel that will keep track of the pages we promote on 10Khits and call this channel 10Khits like so:
image295

Content grouping is like channel grouping. To add a content group, go to “Admin” page, select the view you want to add content grouping and click “Content Grouping”. On the next page, click “+ New Content Grouping”. If you’re an e-commerce site, you might want to group your product pages together like this into a group called Products.
image298

There are 3 ways to group the content: by tracking code, by extraction or by rules. Tracking code allows you add a single line of code that identifies the content index number and the Content Group for the content. Extraction uses regular expression to identify a full or partial URL, page title or screen name. Rule definitions are used to create simple rules that identify your content.

Filed under: Digital AnalyticsDocumentation
Tags: , , , , ,


The Google Analytics reporting interface

Once the data has been processed, you can retrieve the data from Google Analytics using the reporting interface. The reporting interface looks similar to this:
image291

The first column in the reports is the dimension and the rest of the columns are different types of metrics like sessions, % new sessions, new users, bounce rate, pages/sessions and more. All Google Analytics reports are compiled from different combinations of dimensions and metrics. There are many types of reports you analyze such as paid keywords, all traffic, all referrals, channels, social and more. You may also set a secondary dimension for more in-depth reports. For example, if you want to look at the landing pages from the traffic you get from Google / organic, when you view the Google organic traffic just set the secondary dimension to “Landing Pages”. Now it will list all the pages people visit from Google searches.
image293

In this case, 4,275 out of 146,301 sessions went to our forum from the Google search results and 3,336 went to our homepage. Being able to analyze your reports and take the necessary steps to improve your marketing strategy is important to having a successful website or business.

Filed under: Digital AnalyticsDocumentation
Tags: , , ,


What is audience overview in Google Analytics?

Audience overview gives you a glance of user metrics. When you log into your Google Analytics and view a property, by default the audience overview will be displayed. In the audience overview, you will see a line graph of sessions over the last 30 days. Each dot on the graph shows you how many sessions were reported that day. You can move your mouse over each dot for the exact number of sessions for each date. You can also change it from day to hourly, week or month. You can also change the date range from 30 days to however many days, months or years you’d like to look at.
image287

Below the line graph, you’ll see metrics for the following:
1. Sessions – total number of sessions to your site
2. Users – total number of unique users to your site
3. Pageviews – total number of pages viewed by users
4. Pages per Session – average number of pages viewed per session
5. Average Session Duration – average session length of all users
6. Bounce Rate – percent of single-page sessions
7. New Users – percent of total users who visited your site for the first time
image289

You’ll also find a pie chart of new and returning users and some dimensions about your users such as language, country/territory, city, browser, operating system, service provider, mobile screen resolution and more. There are many other audience reports you can take a look at such as: Demographics, Interests, Geo, Behavior, Technology, Mobile, Custom and Users Flow.

Filed under: Digital AnalyticsDocumentation
Tags: , , , , , , , , ,


What is real-time overview in Google Analytics?

Real-time overview lets you monitor activity on your site or app as it happens. Each session is reported seconds after it happens on your website. Some useful things you can do with real-time are: view who’s on your site right now, view what city/country the users viewing your site are from, what sources or medium the users came from, what page they are currently on, what device they use and more.
image286

You can access the real-time overview by clicking on real-time at the left side bar of Google Analytics and clicking “Overview”. There are several other real-time reports available that you can access such as: Locations, Traffic Sources, Content, Events and Conversions.

Filed under: Digital AnalyticsDocumentation
Tags: , , , ,


What is acquisition overview in Google Analytics?

The acquisition overview report is found on the left sidebar of Google Analytics. Just click on Acquisition and Overview underneath it. This report lets you see how you acquire your users, how they behave on your site and their conversion patterns. You will find a top channels pie chart similar to this one which shows the percentage of sessions that came from organic search, direct, referral and social:
image283

There will also be line graphs for sessions and conversions. Below this you can see a table with metrics for acquisition, behavior and conversions (ABC).
1. Acquisition by sessions, % new sessions and new users.
2. Behavior on site by Bounce Rate, Pages per Session and Average Session Duration.
3. Conversion patterns by Transactions, Revenue, Ecommerce Conversion Rate, Goal Conversion Rate, Goal Completions and Goal Value.

You can also browse through the other acquisition reports such as: Channels, All Traffic, All Referrals, Campaigns, Keywords, Cost Analysis, AdWords, Social and Search Engine Optimization. Some of these reports will require you to link your Google Webmasters Tools account or Adwords account.

Filed under: Digital AnalyticsDocumentation
Tags: , , , ,


What is behavior overview in Google Analytics?

Behavior overview report shows you which pages on your website are most popular. To access the Behavior overview, simply click on Behavior on the left sidebar and click Overview underneath it. This report gives you an in-depth glimpse of what pages users visit the most on your website. Like most reports, there will be a line graph at the top of the page. Rather than showing sessions in the line graph, the behavior overview shows the amount of pageviews you receive each day. There are also metrics like pageviews, unique pageviews, average time on page, bounce rate and % exit. You can also view which pages, page titles, search terms and event categories are most popular.
image281

There are other behavior reports available such as the Behavior Flow, Site Content, Site Speed, Site Search, Events and AdSense. You can also create experiments and view In-Page Analytics.

Filed under: Digital AnalyticsDocumentation
Tags: , , , , ,


What are intelligence events in Google Analytics?

Intelligence events are automatic and custom alerts you get from Google Analytics. Google Analytics monitors your website traffic for you and will alert you of any significant statistical variations. For example, if your average session duration dropped by 25% today, you’d be able to see that in the daily reports. There are four kinds of reports: overview, daily, weekly and monthly. An intelligence events overview report may look something like this:
image277

There are also custom alerts you can set up. Simply view one of the reports and click the Custom Alerts tab. Click on “New Alert” and fill out the form below.
image279

You can also set up e-mail alerts or mobile text message alerts. This feature can come in handy when you want to track whether you’re visitors have dropped significantly because of web server issues or if you’ve received a conversion. It’s a great way to be informed about your website and business 24/7.

For more information on intelligence events, you can watch this video:

Filed under: Digital AnalyticsDocumentation
Tags: , , , , ,