How do I setup a property in Google Analytics?

One of the standard tools webmasters use to track website/mobile data is Google Analytics. Properties are where you place the tracking code such as a website or mobile app. To set up your first property, you can do so when you open your GA account or if you’d like to add another property go to your Google Analytics account and click on “Admin”. Click on “Create new property” from the property dropdown.
image310

On the next page, select whether you want to track a website or a mobile app. Give your website a name and input the website’s URL and click “Get tracking code”.
image312

The next page will have the tracking code where you will copy and paste on every page you want to track data from. It is good to place it in your header so that Google Analytics can track a hit even when the user decides to leave the site before it finishes loading. Once you have placed the tracking code on your pages, it should start tracking your data instantly.

Filed under: Digital AnalyticsDocumentation
Tags: , , ,


How do I setup a view in Google Analytics?

A view is the level in Google Analytics where you can access reports and analysis tools. When you add a property, Google Analytics will automatically create one unfiltered view. It is important to never make y changes to your unfiltered view because if you do add filters to your unfiltered view and remove them later on, the data that has been filtered out will never come back. Instead, you can customize multiple views with different settings like one view for internal traffic or one view to track activity coming to a certain page on your website. To create a new view, go to “Admin” and in the property column select the website you want to create a view for in the property dropdown. To the right, you’ll see the view column. Click on the dropdown and click “Create new view”.
image308

On the next page, give your view a name and click “Create View”. After creating your view, you can select it from the dropdown and give it filters, goals and more. For example, you can create a view called “Sign ups” and add a filter that will only track visitors when they land on the Registration complete page.

Filed under: Digital AnalyticsDocumentation
Tags: , , ,


How do I add a filter to my view in Google Analytics?

In “Admin” page, select the view you want to add a filter to and click “Filter”. On the add filter page, you will see something like this:
image307

Give your filter a name such as “Sign ups” and select the filter type. For beginners, you should use predefined filters. When you learn more about regular expressions (ReGex), you can use custom filters which allows you to create more powerful implementations. To learn more about regular expressions you can go to: https://support.google.com/analytics/answer/1034324?hl=en

Moving on to our “Sign ups” example, we can select “Include Only” for the first box. For the second box, we can choose “traffic to the subdirectories”. For the third box, we can choose “that are equal to”. If our website sends the user to domain.com/registration-complete/ after signing up, we can put “/registration-complete/” in the subdirectory field. You can choose whether it’s case sensitive or not and click “Save”.

Now your view “Sign ups” should track visitors who have signed up to your website only. You can experiment with other filters but make sure you do not add any filters to your “All Web Site Data” view as data that has been processed through these filters cannot be changed.

Filed under: Digital AnalyticsDocumentation
Tags: , , ,


What are users, sessions and interactions in Google Analytics?

Users are the visitors who visit your website or mobile app. Sessions are the time they spend on your website or mobile app. Interactions are what the users do while they are on your website or mobile app. For example, think of your website as a restaurant. You’ll have customers (users) who come in once and never come back. You might also have a returning customer (users) who comes to your restaurant multiple times (sessions). For each session, the user will do something like look at the menu, order food, eat their food or pay the bill (interactions). Individual interactions are also called hits. Some users may look at the menu and leave right away because it’s too expensive. Others might spend more time and have more interactions with your website (multiple hits).

Filed under: Digital AnalyticsDocumentation
Tags: , , , , ,


How are returning visitors reported in Google Analytics?

The first time a visitor comes to your website or mobile app, Google Analytics creates a random unique id that is associated with the user’s device. Each unique id is considered a unique visitor. In each hit, this unique id is sent to Google Analytics. If a new id is detected, this means there is a new user. If Google Analytics sees that the id is an existing id in a hit, it will count the hit as a returning user. These ids can be reset or erased if the user clears the cache from their browser or uninstalls/re-installs the mobile app.

Filed under: Digital AnalyticsDocumentation
Tags: , , ,


How are sessions reported in Google Analytics?

A user can have multiple sessions. Sessions can occur on the same day or over several days, weeks or months. When a session ends, there is an opportunity to start another session. By default, Google Analytics ends a session when there hasn’t been any activity from the user in the past 30 minutes. This is based on the session timeout settings. The next time Google Analytics detects a hit from the user, a new session is created. For example, a user lands on a page and idles for 2 hours. After 30 minutes, the session will end. When the user comes back to their computer and interacts with the page again, a new session will be created. Two sessions were counted by Google Analytics. You can change the session timeout based on your business needs from 1 minute to 4 hours.

To change your session timeout, go to Admin and browse to the property you want to change the session timeout for. Click on Tracking Info and click on Session Settings. Here you’ll be able to change the session timeout and campaign timeout.
image305

Filed under: Digital AnalyticsDocumentation
Tags: , , , , ,


How do I import data into Google Analytics?

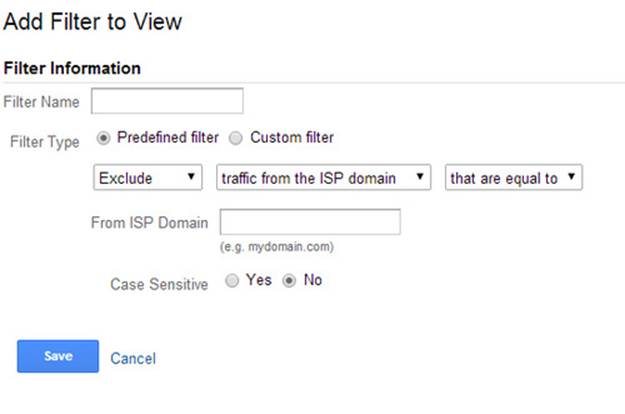
You can use account linking or data import to import data from other sources into Google Analytics without using the tracking code. The data you import from these two options will be processed along with all the hits you collect from the tracking code.
Starting with account linking, you can link Google Products such as Google Adwords, Google Adsense and Google Webmaster Tools with Google Analytics. When you link a Google Product, the data from the product will flow to your Google Analytics account. For example, if you link your Adwords account to your Analytics account, you’ll be able to see your Adwords clicks, impressions and cost data in your Analytics reports.

Additionally, you can import data into your Google Analytics account. To import data into your Google Analytics, a key must exist in both your imported data and Google analytics. The key is the common element that connects the two sets of data.
There are two ways to import data:
1. Dimension Widening
2. Cost Data Import

With dimension widening, you can import almost any data into your Google Analytics. For example, let’s say that you own a library and have a database full of authors and topics. You can import this data into Analytics so that you can segment your data by Author and Topic as long as there is a key for each one. A key that may work for this would be page URLs or some other data that you can find on Google Analytics that you can apply to the imported data. To import this data, you can import a file such as an excel spreadsheet.

With cost data import, you can use this to calculate costs from your non Google advertising campaigns such as Facebook Ads, Twitter Ads, Yahoo ads and more. You’ll need to have campaign source (Yahoo, Bing, Facebook, Twitter) and campaign medium (ppc, display, etc). Data import can be time consuming if it is frequently updated so it’s also recommended to develop a program that uploads the data automatically to Google Analytics using API.

For more information on the reporting APIs, go to: https://developers.google.com/analytics/devguides/reporting/

Filed under: Digital AnalyticsDocumentation
Tags: , , ,


How do I transform data in Google Analytics with filters?

Filters allow you to include, exclude or change the way the data is shown in your reports. For example, you can create a filter to exclude IPs or to clean up URLs into readable text. If you have a filter that excludes an IP, any hit coming from that IP will be permanently removed from your report data.
In “Admin” page, select the view you want to add a filter to and click “Filter”. On the add filter page, you will be able to set the filter information like so:
image307

Filed under: Digital AnalyticsDocumentation
Tags: , , , ,


How do I transform data in Google Analytics with goals?

Additionally, you can set up goals to transform your data. Setting up goals can create new metrics like conversions and conversion rate. For example, you can set up a goal to track sign ups. Each time someone signs up, it will be recorded in Google Analytics as a conversion. In “Admin” page, select the view you want to add a goal to and click “Goals”. Click “New Goal”. Input your goal name and goal type then click next step.
image299

Let’s say that every time a person signs up they are sent to the page: /registration-complete.html. You can set that as your destination page URL. You can also assign a value. For example, if you sell a service that costs $15 you can set the value of each sign up to $15 giving your conversions a monetary value. Even if they do not pay right away and are just a prospect, you can set a monetary value to your goal. For instance, if on average 1 person out of 5 signups actually buy your service at $15 after signing up, you can set the value for each sign up to be equivalent to $3 per sign up since it takes 5 signups for one $15 conversion (5 * $3 per sign up = $15 conversion).
image301

Filed under: Digital AnalyticsDocumentation
Tags: , , , , ,